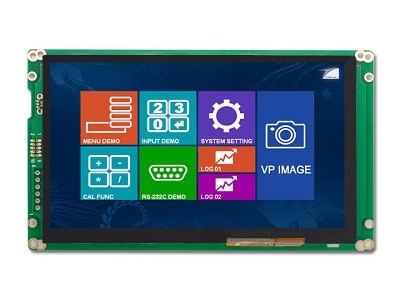
Touch Screen LCD for Water Quality Analyzer
What is water quality analyzer?
Water is the source of life. Water quality analyzing is the premise to ensure safe water use. A typical water quality analyzer has two parts, sensors and main unit with LCD screen. Water quality analyzer can be used for many purposes:
• To identify whether water is meeting designated uses
• To identify pollutants and source of pollution
• To determine trends
Building water analyzer with Smart TFT LCD
This project uses Topway smart LCD module: HMT070ETD-1D
Resolution:1024x600
Interface:RJ45 RS232
Voltage:11V~26V
Temperature:-20°C ~ 70°C
Wide Viewing Angle :Yes
Size:7"
Touch Screen:CTP
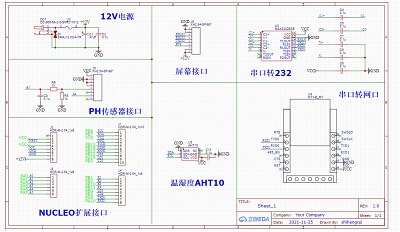
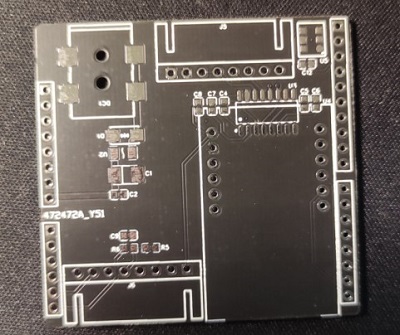
NUCLEO-G070RB and hardware expansion board, PH, humidity & temperature sensors.
一、Project Goals:
1. Collect these data: water temperature and PH value, environment temperature and humidity
2. Collected values displayed on screen in real-time
3. Display historic data as graph
二、Project Steps
1. UI design
1) A picture as home page background, date time and collected data will be displayed here.

2) Historic data page for water quality
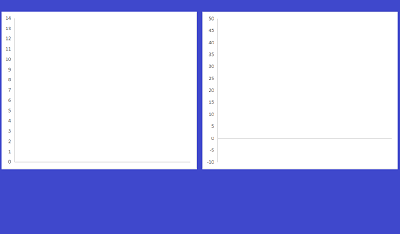

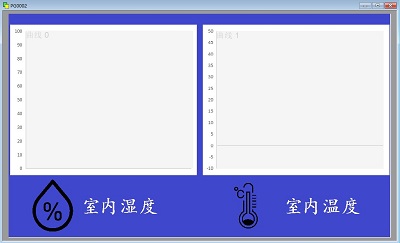
3) Historic data page for environment temperature and humidity
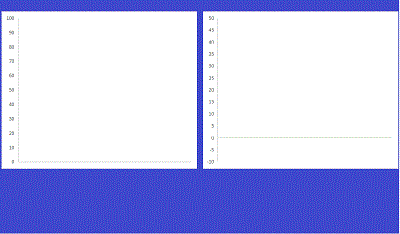

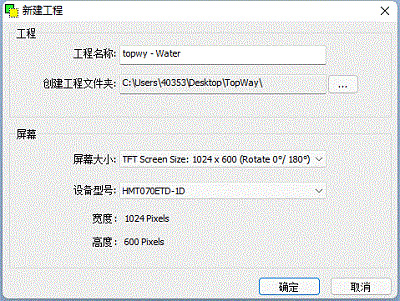
4) Create a project with TOPWAY SGTools
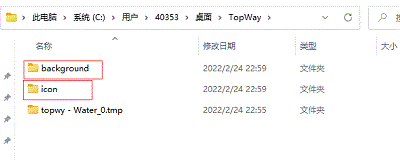
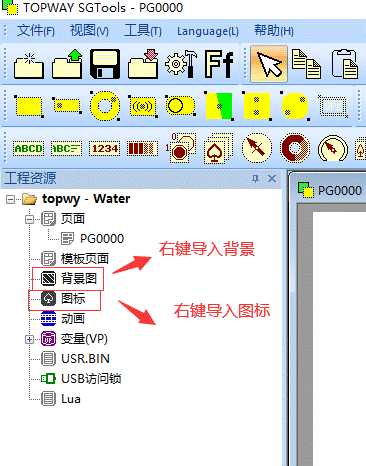
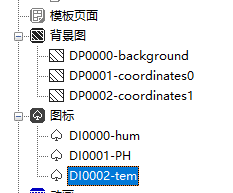
Import background pictures and icons into project
5) select a font type
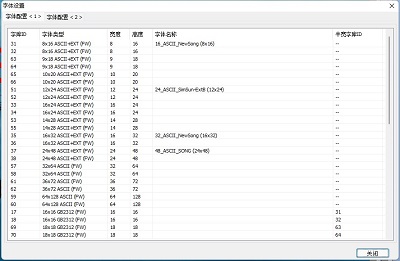
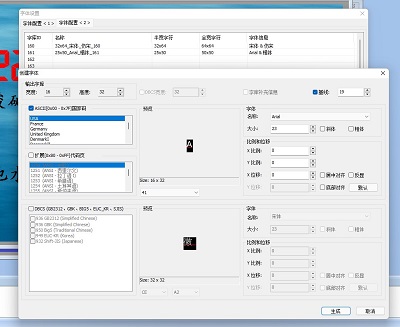
You could modify font size, too.
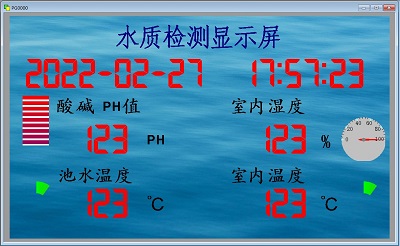
6) Build all pages
These objects are used to build UI pages.
Static String: for labels on pages
Real Time Clock: display date and time
Number Element: display values collected from sensors
Graph Element: real-time plotting value on LCD in graph format
Touch Key: capture user touch action

7) Align icons

8) Variables and bindings.
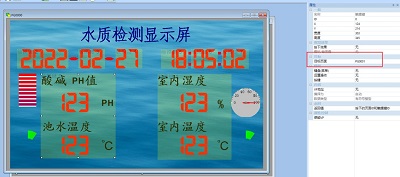
Create 16-bit numeric variables to hold values collected from external sensors and RTC
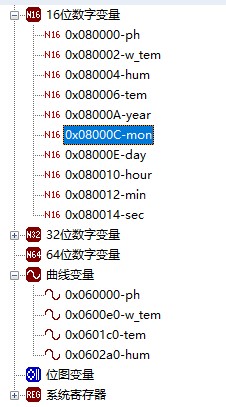
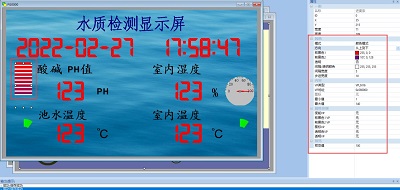
Link page objects with newly created variables and modify the objects’ properties according to need.
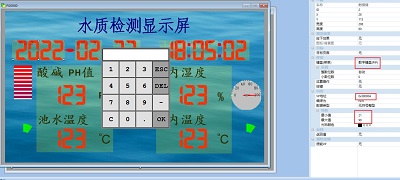
9) Add three touch areas and set up their action targets
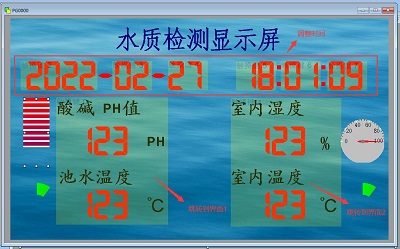
10) Use PIP keyboard acquire new date time values
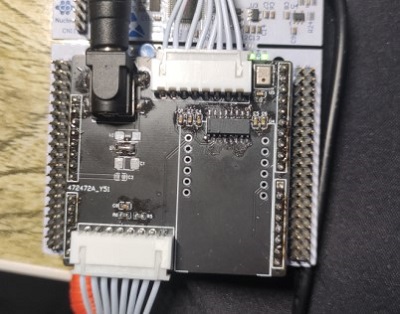
2. Hardware design
3. Software design
1) LCD communication code
Send data to a selected variable
![]()
/**
brief LCD发送16位变量
param adr:变量地址
param dt:发送的变量
return 无
*/
voidlcd_send_pv16(uint32_tadr,uint16_tdt)
{
uint8_tsend_buf[32];
uint8_tidx = 0;
send_buf[idx++] = 0xaa;
send_buf[idx++] = 0x3d;
adr = ntohl(adr);//大小端转换
memcpy((uint8_t*)&send_buf[idx], (uint8_t*)&adr, sizeof(uint32_t));
idx += sizeof(uint32_t);
dt = ntohs(dt);//大小端转换
memcpy((uint8_t*)&send_buf[idx], (uint8_t*)&dt, 2);
idx += 2;
send_buf[idx++] = 0xcc;
send_buf[idx++] = 0x33;
send_buf[idx++] = 0xc3;
send_buf[idx++] = 0x3c;
send_data1(send_buf, idx);
}
Send data for plotting graph

/**
brief LCD左推进写曲线数据
param adr:变量地址
param adr_curve:插入位置
param dt:发送的变量
return 无
*/
voidlcd_send_curve(uint32_tadr,uint16_tadr_curve,uint16_tdt)
{
uint8_tsend_buf[64];
uint8_tidx = 0;
send_buf[idx++] = 0xaa;
send_buf[idx++] = 0x4e;
adr = ntohl(adr);
memcpy((uint8_t*)&send_buf[idx], (uint8_t*)&adr, sizeof(uint32_t));
idx += sizeof(uint32_t);
adr_curve = ntohs(adr_curve);
memcpy((uint8_t*)&send_buf[idx], (uint8_t*)&adr_curve, sizeof(uint16_t));
idx += sizeof(uint16_t);
dt = ntohs(dt);
memcpy((uint8_t*)&send_buf[idx], (uint8_t*)&dt, sizeof(uint16_t));
idx += sizeof(uint16_t);
send_buf[idx++] = 0xcc;
send_buf[idx++] = 0x33;
send_buf[idx++] = 0xc3;
send_buf[idx++] = 0x3c;
send_data1(send_buf, idx);
}
Show a page

/**
brief LCD跳转页面
param page:页面地址
return 无
*/
voidlcd_send_page(uint16_tpage)
{
uint8_tsend_buf[64];
uint8_tidx = 0;
send_buf[idx++] = 0xaa;
send_buf[idx++] = 0x70;
page = ntohs(page);
memcpy((uint8_t*)&send_buf[idx], (uint8_t*)&page, sizeof(uint16_t));
idx += sizeof(uint16_t);
send_buf[idx++] = 0xcc;
send_buf[idx++] = 0x33;
send_buf[idx++] = 0xc3;
send_buf[idx++] = 0x3c;
send_data1(send_buf, idx);
}
Set RTC time

/**
brief LCD设置时间
param page 无
return 无
*/
voidlcd_send_time(void)
{
uint8_tsend_buf[64];
uint8_tidx = 0;
send_buf[idx++] = 0xaa;
send_buf[idx++] = 0x9c;
memcpy((uint8_t*)&send_buf[idx], (uint8_t*)&my_rtc, sizeof(MYRTC));
idx += sizeof(MYRTC);
send_buf[idx++] = 0xcc;
send_buf[idx++] = 0x33;
send_buf[idx++] = 0xc3;
send_buf[idx++] = 0x3c;
send_data1(send_buf, idx);
}
Read RTC time

/**
brief LCD读取时间
param page 无
return 无
*/
voidlcd_read_time(void)
{
uint8_tsend_buf[64];
uint8_tidx = 0;
send_buf[idx++] = 0xaa;
send_buf[idx++] = 0x9b;
send_buf[idx++] = 0xcc;
send_buf[idx++] = 0x33;
send_buf[idx++] = 0xc3;
send_buf[idx++] = 0x3c;
send_data1(send_buf, idx);
}
Code of receiving data
voidlcd_pro(void)
{
staticuint32_ttimer_lcd = 0;
if (timer6 - timer_lcd<9)
return;
timer_lcd = timer6;
if (lcd_rx.len<5)
return;
if (lcd_rx.rx_buff[0] != 0xaa)
{
memset((uint8_t*)&lcd_rx.rx_buff, 0, lcd_rx.len);
lcd_rx.len = 0;
return;
}
else
{
switch (lcd_rx.rx_buff[1])
{
case0x79://触摸
lcd.page = lcd_rx.rx_buff[3];
lcd.touch_id = lcd_rx.rx_buff[4];
break;
case0x77://下发数据
if(lcd_rx.rx_buff[3] == 0x08)
{
if(lcd_rx.rx_buff[5] == 0x0A)//年
{
my_rtc.year = lcd_rx.rx_buff[7];
}
elseif(lcd_rx.rx_buff[5] == 0x0C)//月
{
my_rtc.month = lcd_rx.rx_buff[7];
}
elseif(lcd_rx.rx_buff[5] == 0x0E)//日
{
my_rtc.day = lcd_rx.rx_buff[7];
}
elseif(lcd_rx.rx_buff[5] == 0x10)//时
{
my_rtc.hour = lcd_rx.rx_buff[7];
}
elseif(lcd_rx.rx_buff[5] == 0x12)//分
{
my_rtc.min = lcd_rx.rx_buff[7];
}
elseif(lcd_rx.rx_buff[5] == 0x14)//秒
{
my_rtc.sec = lcd_rx.rx_buff[7];
}
lcd_send_time();
}
break;
case0x9B://读取时间
memcpy((uint8_t*)&my_rtc, (uint8_t*)&lcd_rx.rx_buff[2], sizeof(MYRTC));
break;
default:
break;
}
memset((uint8_t*)&lcd_rx.rx_buff, 0, lcd_rx.len);
lcd_rx.len = 0;
}
}
2) PH value sampling
Sensors used in this project return analog signals
voidph_pro(void)
{
staticuint32_ttimer_ph = 0;
uint16_tadc_value = 0;
floatvol = 0.0;
if (timer6 - timer_ph>PH_COLLECT_TIME)
{
HAL_ADC_Start(&hadc1); //启动ADC单次转换
HAL_ADC_PollForConversion(&hadc1, 50); //等待ADC转换完成
if(HAL_IS_BIT_SET(HAL_ADC_GetState(&hadc1), HAL_ADC_STATE_REG_EOC))
{
adc_value = HAL_ADC_GetValue(&hadc1); //读取ADC转换数据
vol = ((double)adc_value/4096)*3.3*2;//转化为实际电压值
printf("sensor log:adc_value = %d, vol = %.2fV.\n", adc_value, vol);
ph_buf[FILTER_N] = (uint16_t)((5.9647*vol+22.255)*10);//转换为PH值
for (i = 0; i <FILTER_N; i++)
{
ph_buf[i] = ph_buf[i + 1]; // 所有数据左移,低位仍掉
}
pv.ph = MedianFilter(ph_buf, FILTER_N); //中值平均滤波
printf("sensor log:ph %d\r\n", pv.ph);
}
lcd_send_pv16(0x080000,pv.ph);//给LCD发送数据
lcd_send_curve(0x060000,224,pv.ph);//给LCD左推进发送曲线
timer_ph += PH_COLLECT_TIME;
}
}
3) Water temperature collection
With classic DS18B20
voidds18b20_pro(void)
{
uint16_ti = 0;
staticuint32_ttimer_ds18b20 = 0;
if (timer6 - timer_ds18b20>DS_COLLECT_TIME)
{
te_buf[FILTER_N] = DS18B20_Get_Temp();
for (i = 0; i<FILTER_N; i++)
{
te_buf[i] = te_buf[i + 1]; // 所有数据左移,低位仍掉
}
pv.te = MedianFilter(te_buf, FILTER_N); //中值平均滤波
lcd_send_pv16(0x080002, pv.te);//给LCD发送数据
lcd_send_curve(0x0600e0,224,pv.te+100);//给LCD左推进发送曲线
printf("sensor log:te %d\r\n", pv.te);
timer_ds18b20 += DS_COLLECT_TIME;
}
4) Environment temperature and humidity collection
AHT10 and IIC
voidaht_pro(void)
{
uint16_ti = 0;
staticuint32_ttimer_aht = 0;
if (timer6 - timer_aht>AHT_COLLECT_TIME)
{
AHT10ReadData(&tem_buf[FILTER_N], &hum_buf[FILTER_N]);
for (i = 0; i<FILTER_N; i++)
{
hum_buf[i] = hum_buf[i + 1]; // 所有数据左移,低位仍掉
tem_buf[i] = tem_buf[i + 1]; // 所有数据左移,低位仍掉
}
pv.tem = MedianFilter(tem_buf, FILTER_N); //中值平均滤波
pv.hum = MedianFilter(hum_buf, FILTER_N); //中值平均滤波
printf("sensor log:tem %d\r\n", pv.tem);
printf("sensor log:hum %d\r\n", pv.hum);
lcd_send_curve(0x0602a0,224,pv.tem+100);//给LCD左推进发送曲线
lcd_send_curve(0x0601c0,224,pv.hum);//给LCD左推进发送曲线
lcd_send_pv16(0x080004,pv.hum);//给LCD发送数据
lcd_send_pv16(0x080006,pv.tem);//给LCD发送数据
timer_aht += AHT_COLLECT_TIME;
}
}
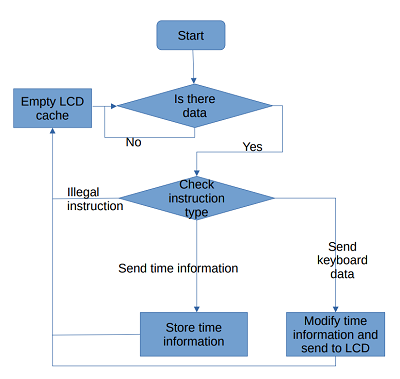
5) Operation flowchart
4. Project at run-time
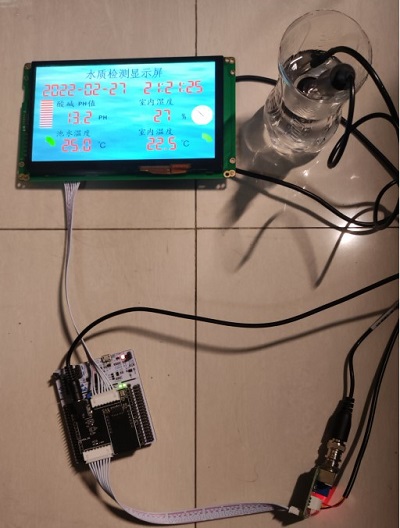
1) Home page
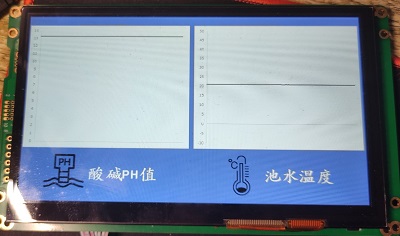
2) water quality historic data page
3) temperature and humidity historic data page
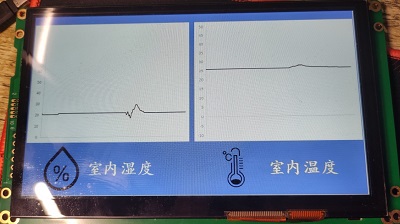
5. Summary
From above project, you can tell that creating user interface with Smart TFT LCD is very easy. Engineer doesn’t need to write any code to drive the LCD and respond to user input.

